Tap water and supplyGuide
Lake Sonoma water level: how full Lake Sonoma and Lake Mendocino are, and what it means for your water
Lake Sonoma is nearly full for water supply. On October 27, 2026 it held 226,904 acre-feet, about 93% of its 245,000 acre-foot water supply pool, and it ended September fuller than in any year since at least 1991. Lake Mendocino is lower, at about 71% of its supply pool, and is the lake to watch this winter.
Yes, Lake Sonoma is nearly full, by the measure that matters for your tap. For most people on city water, that means next summer starts from a strong position.
On October 27, 2026 the lake held 226,904 acre-feet.[1] An acre-foot is enough water to cover an acre one foot deep, about 325,851 gallons. That fills about 93% of the lake's water supply pool, the part stored for water supply: taps, farms and the flow the river must keep.[2] The lake ended this summer fuller than in any year since at least 1991.
Lake Mendocino, the smaller lake upriver, is near average for this time of year, at about 71% of its water supply pool.[3] But it is smaller, drops faster than Lake Sonoma, and will likely count as Dry on November 1 unless rain comes first. If you live between Ukiah and Healdsburg, including Hopland and Cloverdale, it matters more.
Below: what "full" means for these lakes, how this fall compares with 35 others, why Lake Mendocino is the one to watch, and how to check both yourself.
Start at the dam
Drive 11 miles up Dry Creek Road from Healdsburg and you reach the foot of Warm Springs Dam.[4] Behind it is Lake Sonoma. In front of it is a fish hatchery.
The fish ladder there opens by mid-October. Salmon and steelhead trout jump up seven steps to reach the top of the ladder.[4] The hatchery raises coho salmon and steelhead for the Russian River.[4]
Three things depend on the water behind that dam.
- Your tap. Lake Sonoma provides drinking water to most of the area served by Sonoma Water.[5] That is the county agency that supplies river water to cities and water districts serving over 600,000 people.[2]
- The creek. Water released from the dam keeps Dry Creek flowing 14 miles to the Russian River.[6] Coho salmon, Chinook salmon and steelhead live in it.[6]
- The hatchery. It relies on cold water from the lake. Making that cold water more reliable is one goal of a newer way of running the lake, described below.[7]
Our summers bring almost no rain. So through summer and fall, the Russian River runs largely on water released from these two lakes.[5] Sonoma Water pulls its supply from wells beside the river near Wohler Bridge and Mirabel Park.[2] See where your tap water comes from for the rest of the trip.
What does "full" mean for a lake like this?
Our take: judge a lake by its water supply pool. Here is why you may also see a much lower number.
Each lake has two parts, stacked like layers.[2][5]
- The water supply pool is the bottom layer. Sonoma Water decides how much to release from it.
- The flood control pool sits on top. The U.S. Army Corps of Engineers, the federal agency that runs both dams, decides releases from it. After a storm it lets water out to make room for the next one.[7]
Look at the dashed lines: both lakes are well into their supply pools, and Lake Sonoma is close to the top of its.
Source: California Data Exchange Center and Sonoma Water.[1][3][2] Data.
So the same lake has two numbers. Lake Sonoma is about 60% of its total size, but about 93% of its water supply pool. The flood space is meant to sit empty in winter, so counting it makes a healthy lake look half empty.
Is Lake Sonoma fuller than usual?
Yes. The end of September is the best day to compare years: summer is over and the rain has not started. Look at the blue bar on the right.
Source: California Data Exchange Center.[1] Data and method.
- A record for our 36 years. On September 30, 2026 the lake held 232,774 acre-feet. The 1991 to 2025 average was about 202,000. It has dropped a little since, to 226,904 on October 27.
- Four strong falls in a row. 2023, 2024, 2025 and 2026 are the four highest on the chart.
- Sonoma Water says the lake can supply water for more than one year, which is why it is the county's drought cushion.[5]
One thing changed recently. Starting in 2022, under a temporary approval, the Corps has let Lake Sonoma hold some extra water in winter when forecasts show no big storm coming. It is called forecast-informed operations. From October 2022 to September 2023, it let the lake keep more than 19,000 extra acre-feet.[7] Lake Mendocino has used the same approach longer. The El Niño guide explains how.
Lake Mendocino is the one to watch
Lake Mendocino is much smaller, a bit under a third of Lake Sonoma's size.[2] Sonoma Water says it is not a lake that can store water for more than one year, the way Lake Sonoma can.[8]
It matters more than its size suggests:
- It feeds the upper river, from near Ukiah down to where Dry Creek joins the Russian River, and Sonoma Water calls it a key drinking water source for Ukiah, Healdsburg, Cloverdale and Hopland.[8][5]
- It feeds the lower river too, from Dry Creek to the ocean. Sonoma Water says that from June to September 2025, about 62% of the water entering that stretch came from upstream, mostly Lake Mendocino releases.[8]
- It gets far less help refilling. Some water from the Eel River, a different river, is sent over through PG&E's Potter Valley Project and flows down to the lake.[2] Sonoma Water says that now averages under 40,000 acre-feet a year, down from an average of about 150,000 when the river's flow rules were set in 1986.[8] See the Eel River dams story.
The dashed line is the amount Sonoma Water aims to keep in the lake on October 1, so it would not drain in a severe drought: 36,000 acre-feet. Three years ended below it: 2002, 2014 and 2021.
Source: California Data Exchange Center; 36,000 target from the state order described below.[3][8] Data.
The state sets rules for how much water must flow in the Russian River. Under a short-term state order dated May 20, 2026, Lake Mendocino's level puts the river in one of three groups: Normal, Dry or Critical.[8] The group sets how much water must stay in the river. It is not a watering rule for your house. Those come from your city or water district.[5]
These lines are higher than the 36,000 target, and they change each month. Here they are for this fall. A lake below the line on that date counts as Dry or Critical.
| Date | Dry below | Critical below |
|---|---|---|
| October 1 | 58,000 | 46,000 |
| November 1 | 51,000 | 41,000 |
| December 1 | 49,000 | 40,000 |
Acre-feet in Lake Mendocino.[8] The order ends in November. Sonoma Water has asked to keep using these lines from November 16, 2026 to May 14, 2027.[9] See our news post on the request.
Short version: unless rain comes first, Lake Mendocino will count as Dry on November 1, not Critical. On October 27 it held 49,800 acre-feet, already under the November 1 Dry line of 51,000.[3] It was dropping about 350 acre-feet a day, about 114 million gallons.
What a really dry year looks like
2021 shows what the low bars on those charts mean.
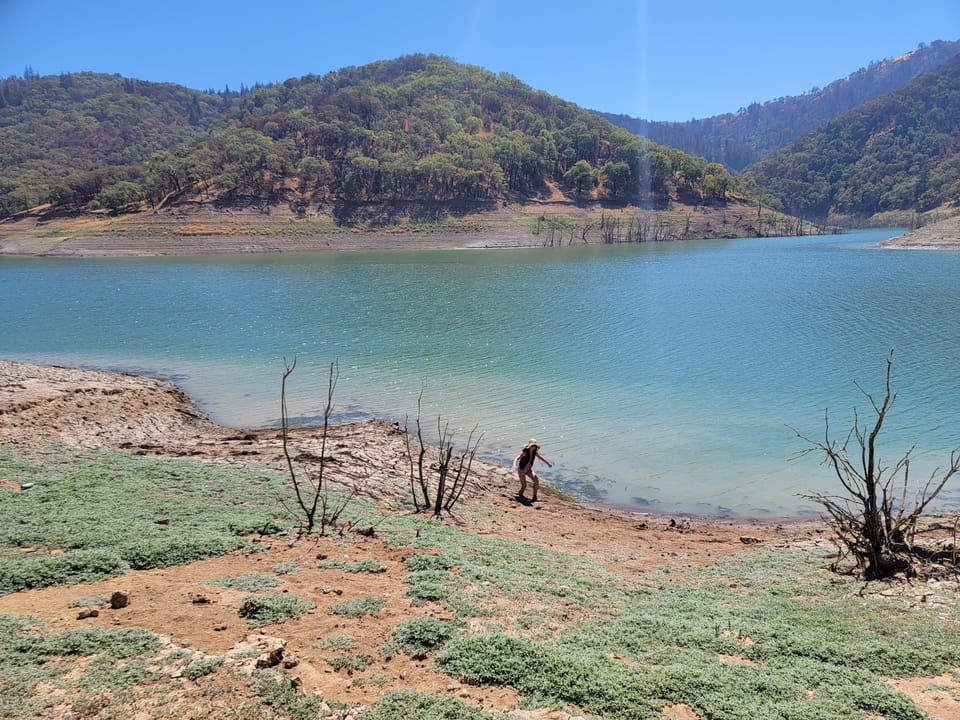
- Lake Mendocino fell to 15,130 acre-feet on September 30, 2021, the lowest month-end since at least 1990.[3] In May, Sonoma Water had warned that if a temporary flow cut ended in July, the required upper river flow would drain the lake by mid-September.[10]
- Lake Sonoma fell to about 109,000.[1] The state ordered Sonoma Water and the cities and districts it sells to, to cut what they took from the river by 20%.[11]
- People came through. From July 1, 2021, Sonoma Water's customers cut river use by nearly 22% compared with 2020.[11]
- The low point came later. After a third dry winter in a row,[11] Lake Sonoma hit its lowest level on record in December 2022, about 40% of its supply pool.[7]
Then it came back fast. Lake Sonoma went from about 110,000 acre-feet at the end of September 2022 to about 231,000 a year later.[1]
Should the river get less water so the lakes keep more?
This is the argument behind the Dry and Critical lines above. The current Lake Mendocino lines were developed in 2023, and the state has approved them in short-term orders every year since.[9] The 2026 order also lowered the summer flow the river must carry in Normal years.[8]
The case for lower summer flows. Federal fish biologists found the old summer flows too fast for young coho and steelhead, and found that big releases use up the cold water in Lake Mendocino that young fish need in summer and fall.[8][6] Lower flows also keep more water in the lake for a dry year.[8]
The case against, or for caution. In comments on the 2026 order, one commenter said the higher flows of the past made the lower river cleaner and better for recreation, and asked why Lake Sonoma isn't used more to keep the river up. She also asked whether the lower flows have been shown to help fish. Russian Riverkeeper, a river advocacy group, asked the state to require ongoing water conservation and better tracking of who uses how much water, and asked Sonoma Water to keep working on a permanent rule change and give a timeline for it. It also argued that renewing short-term orders year after year skips the full environmental review a permanent change would get.[8]
Sonoma Water's answer on Lake Sonoma: it is the larger, multi-year lake, while Lake Mendocino is the one at risk of draining, so the rules are built around it. On fish, it says slower summer water gives young coho and steelhead better places to grow, and keeps more cold water in Lake Mendocino.[8][9]
Our view: the fish science points toward lower summer flows, and we find that case strong. But people who swim and paddle the lower river in summer have a real stake too. Saving water at home is the part of the answer everyone can share.
How to check the lakes yourself
- Open the lake's page on the California Data Exchange Center, the state's site for water data: Lake Sonoma (code WRS) or Lake Mendocino (code COY).[1][3]
- In the list of data, pick "Reservoir storage, AF" marked "(daily)". AF means acre-feet. Take the newest number.
- Divide it by the water supply pool, 245,000 for Lake Sonoma or 70,000 for Lake Mendocino, and multiply by 100.[2] That is percent full for water supply.
Sonoma Water also posts weekly charts and rainfall totals on its water supply levels page.[5]
What it means for you
- On city water from the Russian River: not sure if that is you? See where your tap water comes from. If it is, next summer starts from a strong position. Lake Sonoma is close to full before the rains.
- Between Ukiah and Healdsburg, including Hopland and Cloverdale: Lake Mendocino matters more. A dry winter would be felt there first. Check it in February and March, after the main storms.
- Either way, the risk is a run of dry winters, not one. 2021 and 2022 showed how fast the lakes drop. What helps is cheap and dull: fix leaks, water less in summer, and keep winter rain on your land in a barrel, tank or rain garden. Start with water rebates and the rain catch calculator.
- Every gallon you save in summer is a gallon that can stay in a lake for fish and for next year. See how the Russian River works.
Back at the foot of Warm Springs Dam, coho spawning at the hatchery begins in mid-November.[4] By then the first storms should be adding to the lake again. Next: how much rain Sonoma County gets, month by month.
Photos by Devan Hemmings unless noted.
Sources
- 1. California Data Exchange Center (DWR), Warm Springs Dam, Lake Sonoma (station WRS): daily and monthly storage, pulled October 28, 2026
- 2. Sonoma Water, Water Supply
- 3. California Data Exchange Center (DWR), Coyote Valley Dam, Lake Mendocino (station COY): daily and monthly storage, pulled October 28, 2026
- 4. California Department of Fish and Wildlife, Warm Springs (Don Clausen) Fish Hatchery
- 5. Sonoma Water, Current Water Supply Levels (checked October 28, 2026)
- 6. Sonoma Water, Dry Creek
- 7. Center for Western Weather and Water Extremes (UC San Diego), Lake Sonoma Forecast Informed Reservoir Operations fact sheet (January 2024)
- 8. State Water Resources Control Board, order on Sonoma Water's temporary urgency change petitions, May 20, 2026
- 9. Sonoma Water, Temporary Urgency Change Petitions, with fall 2026 questions and answers (checked October 28, 2026)
- 10. Sonoma Water, Sonoma Water commits to 20 percent reduction in Russian River diversions (May 13, 2021)
- 11. Sonoma Water, Drought Is Here. Save Water. (drought updates, 2021 to 2022)
Checked 2026-10-28. Rules and programs change. If something here is out of date, the source above wins. Spot an error? See our corrections policy.
Related reads
 Tap water and supplyWater map: your supplier, watershed and groundwaterEnter an address or click the map. We show who supplies your water, which watershed you live in, and which groundwater basin is under you.Updated Oct 11, 2026
 Tap water and supplyWhere Sonoma County tap water comes from, and who gets itTurn on a tap in Santa Rosa or Petaluma and the water very likely came from the Russian River. Wells beside the river pull it from the gravel below. It gets chlorine and a pH boost, then travels by pipe to your city. In summer, that river water is winter rain released from Lake Mendocino and Lake Sonoma. On a private well? This page is not about your water.Updated Oct 18, 2026
 Tap water and supplyIs your Sonoma County water safe to drink? City, well, tank, creek and rainCity water is disinfected with chlorine, and Sonoma Water and Santa Rosa say they add no fluoride. Wells, tanks, creeks and rain have no one testing them for you. Look up your supplier, then find your source below.Updated Oct 11, 2026