Rain and storageGuide
What is an atmospheric river? Sonoma County's biggest storms, rated 1 to 5
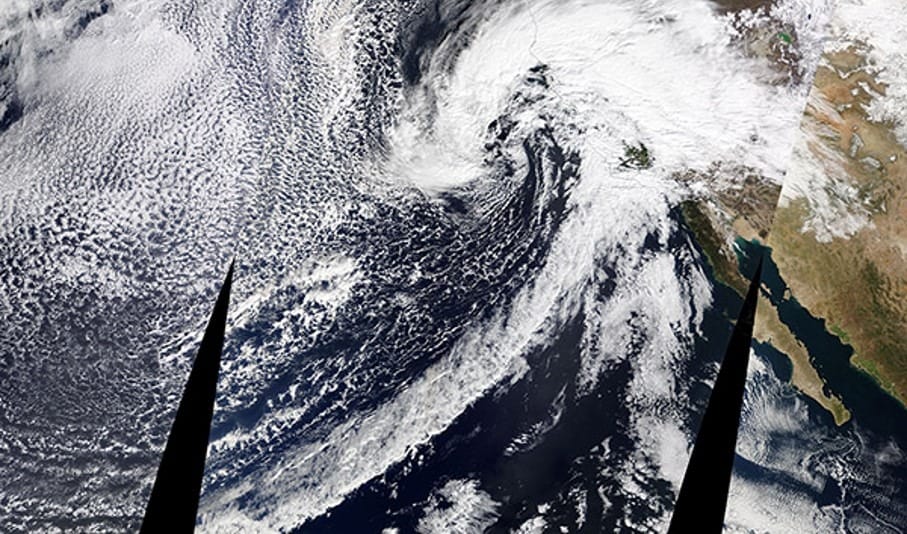
An atmospheric river is a long, narrow stream of water vapor in the sky that carries Pacific moisture to our coast. When one stalls over Sonoma County's hills, it can rain hard for a day or more. Forecasters rate them 1 (mostly helpful) to 5 (mostly harmful). They fill our reservoirs, and they cause nearly all of the county's flood damage.
Listen to this article
Read aloud by an AI voice.
On the Sonoma Coast at Bodega Bay, NOAA runs an atmospheric river observatory. Every hour it measures the wind and moisture coming in off the Pacific. It is one of four in California, and its readings help Sonoma Water and the Army Corps of Engineers run the county's reservoirs.[1]
Most of these storms are welcome. About half of the atmospheric rivers that reached the West Coast from 1978 to 2017 caused no insured flood losses at all.[2] A few became the storms people here remember for decades.
Here is what the 1 to 5 rating means, why the same storm can be a gift in November and a flood in February, and what to do when a big one is on the way.
What is an atmospheric river, in plain words?
Picture a river on land, then lift it into the sky. Instead of water, it carries water vapor, the invisible kind that turns into rain.[3]
- Big. About 250 to 375 miles wide, and can be more than 1,000 miles long.[3]
- Wet. On average it moves more than twice the flow of the Amazon River, as vapor.[2]
The rain comes when it reaches land. The moist air is pushed up over the coastal hills, cools, and drops its water.[3][4]
You may hear "Pineapple Express." That is one kind of atmospheric river, which picks up warm, moist air near Hawaii.[3]
Sonoma County sits where these storms come ashore most often on the West Coast.[2]
What do the numbers 1 to 5 mean?
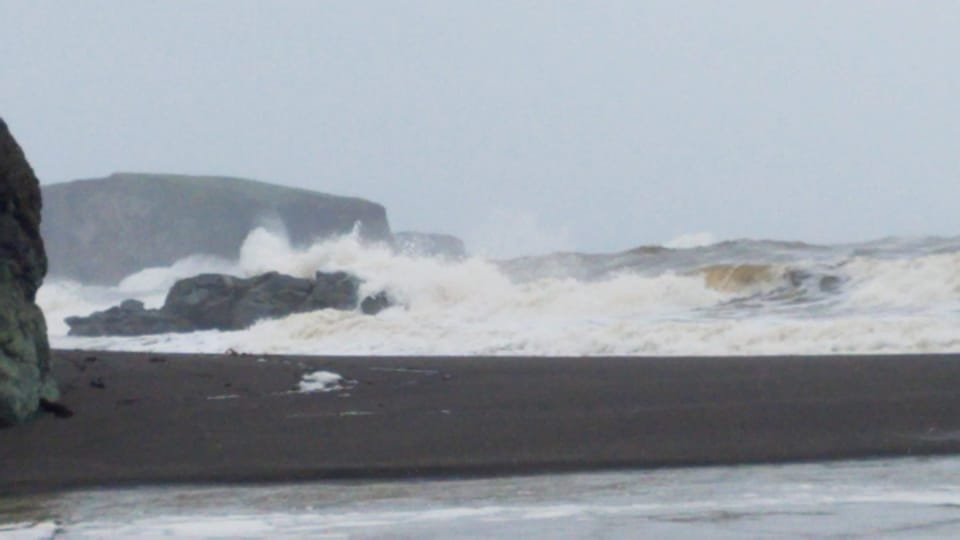
In 2019, storm researchers at Scripps Institution of Oceanography, part of UC San Diego, and the National Weather Service made a 1 to 5 scale for these storms. It works a bit like the scale for hurricanes.[5] The research center behind it is called CW3E, the Center for Western Weather and Water Extremes.
It rates two things: how much water vapor the storm carries, and how long it sits over one place. A storm that passes in under 24 hours drops one category. One that lingers more than 48 hours goes up one.[5]
The chart shows what each step tends to do. Look at how fast the damage climbs.
- A 3, for example. An October 2016 Category 3 dropped 5 to 10 inches. It helped refill reservoirs after a drought and pushed some rivers to just below flood stage, the level where a river starts to spill onto the land around it.[5]
- A 5. The New Year's storm of 1996 to 1997 sat on the Central California coast for more than 100 hours and caused more than $1 billion in damage.[5]
Why did a Category 3 flood Guerneville?
On February 25 to 27, 2019, a long atmospheric river stalled over Northern California. Over much of the North Coast, it rated a 3.[6]
The wettest rain gauge in Northern California that storm, at Venado, a ridgetop weather station west of Healdsburg,[7] caught 21.36 inches in 48 hours.[6][8] That is almost two thirds of a normal year in Santa Rosa, in two days.[9]
The Russian River at Guerneville rose to 45.38 feet, more than 13 feet over flood stage (32 feet there) and its sixth highest crest since records began in 1940.[10] More than 2,000 homes and businesses in Sonoma County flooded. Guerneville and Monte Rio were cut off.[8]
So why so bad for a 3? The rating already counts how long a storm lasts. What it can't see is the ground.[5] This one fell on soil already soaked from earlier storms.[8]
Flood insurance claims across the West, 1978 to 2017, show why timing matters:[2]
- Dry ground soaks it up. The two least damaging Category 5 storms hit thinly settled places early in the wet season, while soils were still dry. Each did less than $10 million in damage.
- Wet ground sends it to the river. The most damaging Category 1 came two weeks after the 1996 to 1997 New Year's storm, with soils full and rivers already high. It did more than $200 million in damage.
- Back to back is worse. A storm that comes within 10 days of a big one (a 4 or 5) does much more damage on average.
- Damage comes later. Across the West, damage runs about a month behind the storms. Most of it comes November to March.
So early storms are less likely to flood. The ones to watch come once the ground is full. On the Russian River, the big floods have come mostly in January and February.[10] See what floods at each level.
They bring our water, too
Atmospheric rivers bring 30 to 50% of all the rain and snow on the West Coast.[11] Around the Russian River, they are the main driver of both drought and flood.[12]
One storm can change a lot. Lakes are measured in acre-feet. One acre-foot is about 326,000 gallons, enough to cover a football field a foot deep.[1] In January 2023, a single atmospheric river took Lake Mendocino from under 40,000 acre-feet in December to nearly 100,000.[1] See how full the lakes are going into winter.
The fish wait for them too. Coho salmon and steelhead often can't reach their spawning creeks until storms raise the flows and reconnect the creeks to the river.[13] See when and where to see salmon spawn.
Why Sonoma County pays the most
From 1978 to 2017, Sonoma County had more flood damage from atmospheric rivers than any other of the 414 counties in the 11 western states: an estimated $5.2 billion, from $172 million in insured losses times 30.[2] More than 99% of the county's flood damage came from these storms.[2][14]
That is about 1 of every 8 dollars of the West's estimated atmospheric river flood damage. It works out to an estimated $130 million a year.[2]
Across the West, a few storms did most of the damage. The January 1995 storm, which kept the Russian River above flood stage for a week and flooded Guerneville, cost more in insured losses than any other storm in the West in those 40 years.[2]
The strongest atmospheric rivers are expected to get wetter, longer and wider as the climate warms, so the damage could grow. The flood researchers who counted these losses point to restoring natural floodplains as one way to cut it.[2]
Our take: rain that soaks in where it lands is rain that does not rush to the river all at once. A yard can do a small part. See how to slow it, spread it and sink it.
When a big one is coming, what do I do?
The good news: these storms are easy to see coming. Forecasters rarely miss one three to five days out, Marty Ralph, director of the Scripps center that made the 1 to 5 scale, said in 2023.[1]
- Now, before the season. Sign up for SoCoAlert, the county's emergency alerts by text, phone or email.[15]
- Watch the forecast. NOAA's atmospheric river forecast maps show these storms days before they arrive.[16]
- When a 3 or higher is forecast, think back. Has it rained a lot in the last few weeks? Then treat it like a bigger storm, as in 2019.[2] Near the river, check the Russian River forecast.
- A day or two out, clear the way for water. Clean gutters and downspouts, and rake leaves off the street drain by your house. See where storm drains go.
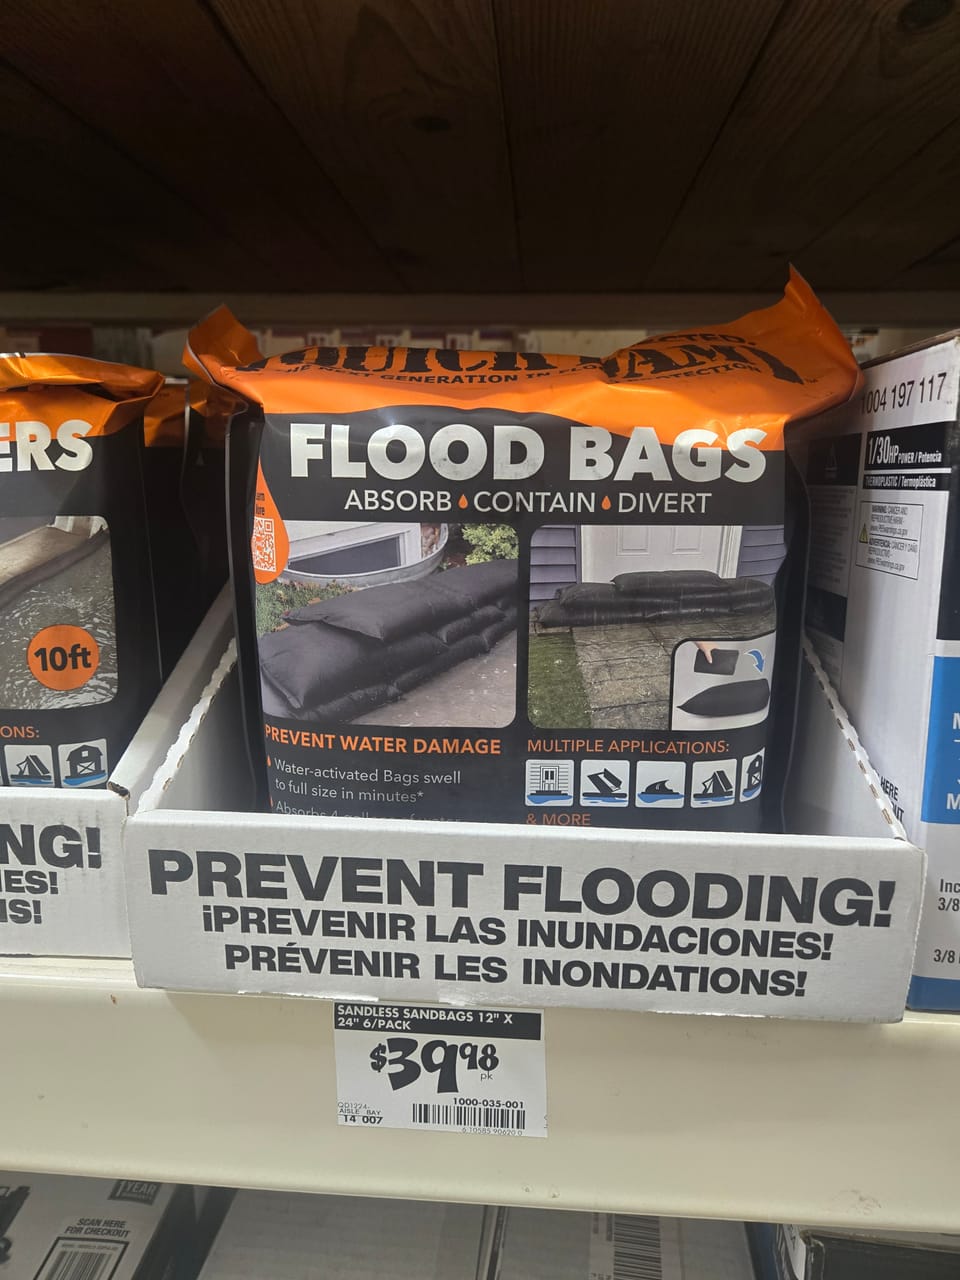
- Get sandbags early. Outside city limits, the county runs self-fill stations with sand, bags and shovels. Some stations run out, so check the list first, and bring your own shovel; the county's have gone missing.[17] In a city, check with your city.
- On a well? When the power goes out, so does your pump. See how to get a well ready for an outage.
- Never drive into floodwater. Just 12 inches of moving water can carry away most cars, and the road under it may be gone.[18]
What it means for you
- An atmospheric river is a river of vapor in the sky, rated 1 (mostly helps) to 5 (mostly harms).
- The rating is half the story. The same storm soaks in on dry November ground and runs off in February.
- Sign up for SoCoAlert now, before the January and February storms.
Next time a big one is forecast, the observatory at Bodega Bay will be taking its hourly readings as it comes ashore. Then it is your gutters' turn. To see what one storm could put in a tank instead, try the rain catch calculator.
Photos by Devan Hemmings unless noted.
Sources
- 1. National Association of Counties, Atmospheric rivers offer opportunity for Sonoma County reservoirs (March 27, 2023)
- 2. Corringham, Ralph, Gershunov, Cayan and Talbot, Atmospheric rivers drive flood damages in the western United States, Science Advances (December 2019), copy hosted by Sonoma Water
- 3. NOAA NESDIS, What Is an Atmospheric River?
- 4. Ralph and others, Flooding on California's Russian River: Role of atmospheric rivers, Geophysical Research Letters (2006), USGS record
- 5. Center for Western Weather and Water Extremes (CW3E), Scripps Institution of Oceanography, new scale for the strength and impacts of atmospheric rivers (February 2019)
- 6. CW3E, Atmospheric river update: 25 to 27 February 2019 post-event summary
- 7. Sonoma Index-Tribune, Community of Venado known for its heavy rainfall (August 26, 2020)
- 8. NASA Earth Observatory, Flooding on the Russian River (March 6, 2019)
- 9. NOAA California-Nevada River Forecast Center, climate station precipitation summary (Santa Rosa normal, 1991 to 2020)
- 10. NOAA National Weather Service, Russian River at Guerneville (GUEC1): flood categories and historic crests
- 11. Dettinger, Atmospheric rivers as drought busters on the U.S. west coast, Journal of Hydrometeorology (2013), USGS record
- 12. Sonoma Water and CW3E, Forecast Informed Reservoir Operations: progress at Lake Mendocino (fact sheet, fall 2018)
- 13. Sonoma Water, update on salmon surveys and river operations for its advisory committees (January 5, 2026)
- 14. Sonoma Water, Sonoma County Flood Risk Management Assessment
- 15. County of Sonoma, SoCo Emergency: Sign up for Alerts
- 16. NOAA Physical Sciences Laboratory, AR Forecasts (atmospheric river forecast maps made with CW3E)
- 17. County of Sonoma, SoCo Emergency: Sandbags (self-fill stations outside city limits)
- 18. National Weather Service, Turn Around Don't Drown
Checked 2026-11-03. Rules and programs change. If something here is out of date, the source above wins. Spot an error? See our corrections policy.
Related reads
 Rain and storageRain catch calculator for your roofA 1,000 square foot roof catches about 15,700 gallons in an average Santa Rosa year. Enter your ZIP and roof size to see yours.Updated Oct 18, 2026
 Rain and storageAre rain barrels legal in California? Yes. Here is when you need a permitYes. State law says you do not need a water right to use rainwater from your roof. Under the state plumbing code, a barrel or tank up to 5,000 gallons for drip or hose watering needs no permit if it sits on the ground, is no taller than twice its width, has no pump and is not hooked to tap water.Updated Oct 18, 2026
 Rain and storageHow much rain Sonoma County gets, town by town and month by monthSanta Rosa gets about 30 to 34 inches in an average year, depending on the gauge and the years counted. Petaluma gets about 26 and Healdsburg about 43. Most of it falls from November to March.Updated Oct 18, 2026